
How we used the improvement kata to gain 25% of productivity - Part 2
In my previous post, I described the productivity issue our team was facing. How retrospectives did not work, and how I started looking at the improvement kata.
We had gone through the first phase of the improvement kata : set the end goal.
Generating enough profit for the business while sticking to a sustainable pace.
Time to start the second phase : Understand.
Understand
Where we really slower ? Or was it an illusion ?
When trying to understand, you have to start with the data you have. You continue digging until you get a deeper understanding of the situation.
Velocity
We started with available data : story points and velocity. For sure this is a pretty bad measure of productivity. (Note : we should never use velocity for performance appraisal) In our case though, it felt like a good starting proxy measure.
Here is our velocity curve over 2 years.
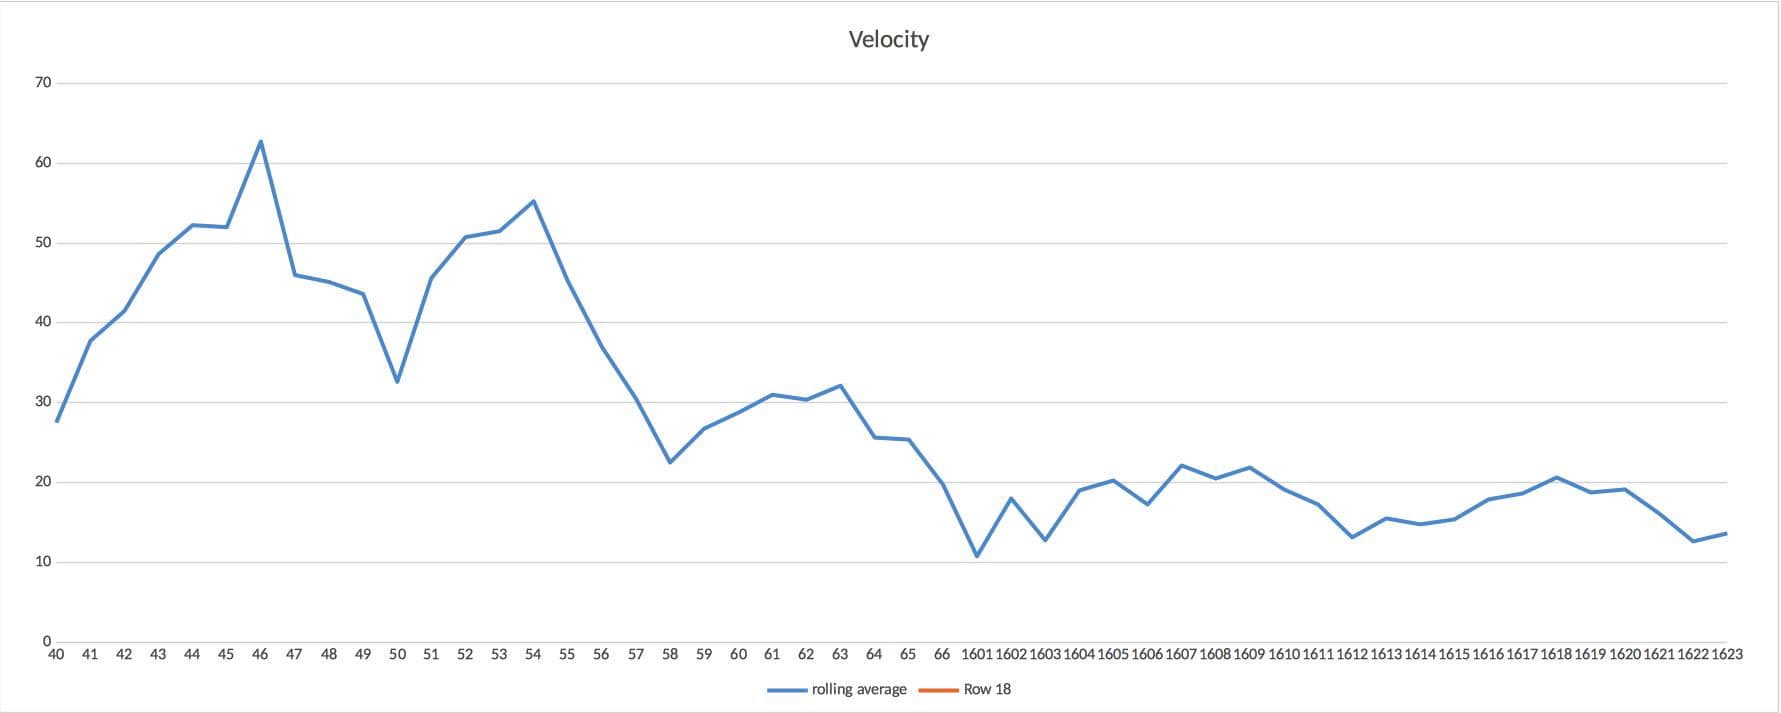
It’s obvious that something changed. There are 2 parts to this graph. The velocity dropped between sprint 54 and 16.01. That’s a clue that our gut feeling was not completely wrong. Our productivity did change.
Man days
Our first hypothesis was that team members turnover was the cause. As with any team, some people came, and some people left. Let’s superpose the man days and velocity curves.
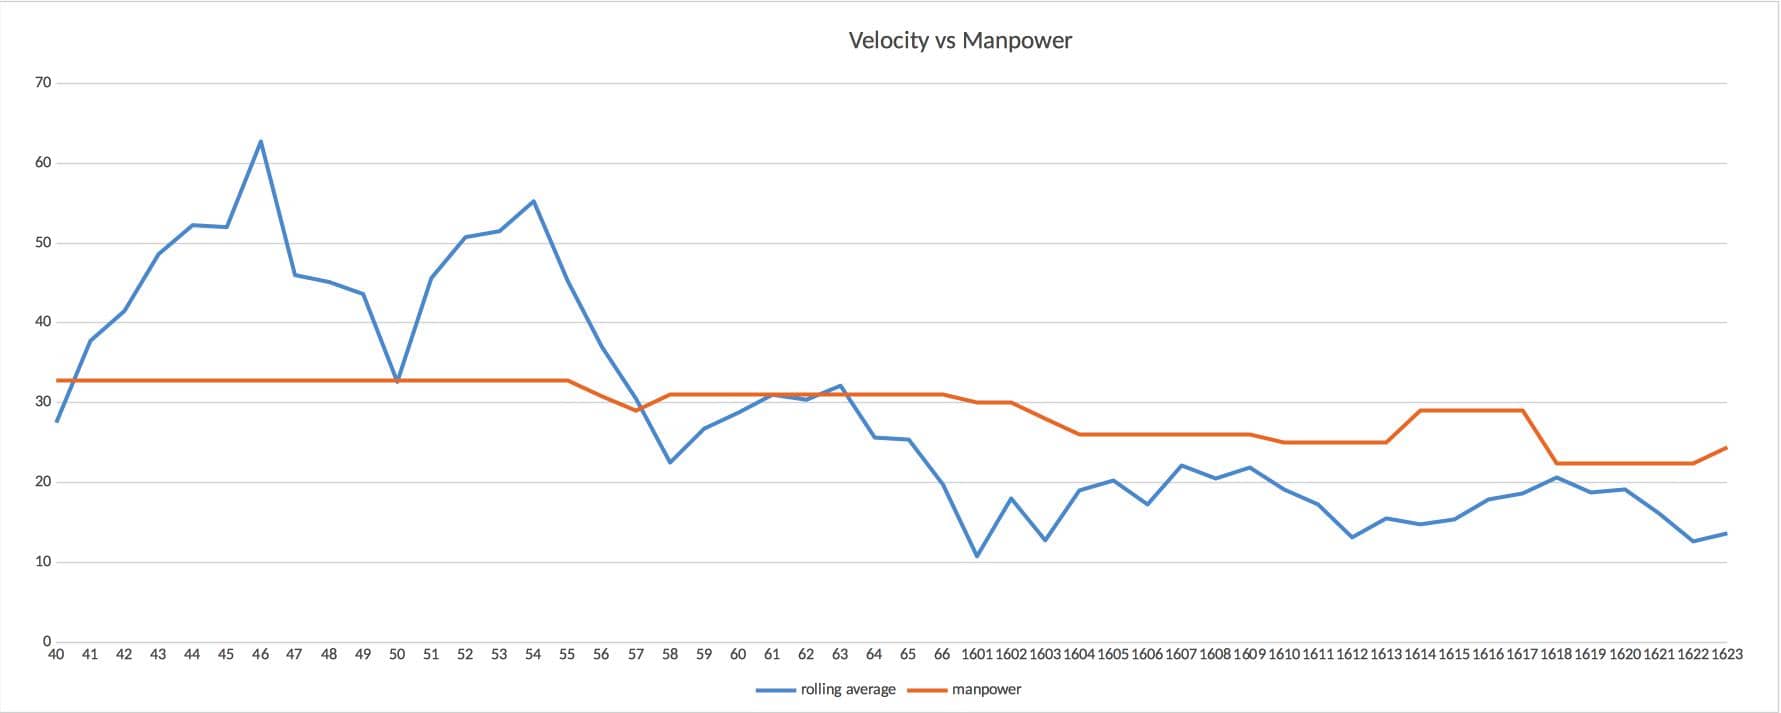
That could only explain part of the problem !
We tried to fine tune the man days curve. We took people’s involvement in tasks outside of programming into account. We used coefficients depending on the developers’ experience. That did not provide a better explanation.
We had to find another explanation.
Velocity computation
As I said earlier, velocity is not a measure of productivity. Any change in the way we were computing velocity would impact this curve.
We had kept photos and Trello boards of our retrospectives meetings. We searched them through for anything that could impact velocity. Here is what we found :
- At sprint 55, we decided to ditch the focus-factor
- At sprint 61, we started to do regular exploratory-testing. Exploratory testing discovers more bugs on top of user reported bugs. This made us spend more time on fixing bugs.
- At sprint 62, as we opted for a No Bug policy we decided not to count story points for bugs
💡Keep Photos and Trello boards of Retrospectives as a log of your working agreements changes
The timings almost perfectly matched what we had observed in the first place. The question that came to our minds was :
Are we spending too much time on bugs ?
Halfway through understanding
This is how we started to dig into our situation. It’s a good time to give you a bit of feedback about how we felt at that point.
It was the first time we tried the improvement kata. More than that, we did not find any tutorial or guides about how to run it. The only instructions we had were theoretical descriptions or super concrete examples. We had to bridge the gap and come up with our own way.
To summarize, we felt a bit lost, we had gathered data from here and there, and we did not know what to look at next. On top of that, the quality of the data we were collecting was not great. We were wondering if we would get anything out of these investigations.
It felt a bit like when I did the 20 hours experiment to learn anything. We did exactly what had worked with the learning experiment : we pushed through !
💡If you feel lost when doing something for the first time. Push through !
In next week’s post, I’ll continue to detail the ‘understand’ phase. The series also gained an extra post, and will now be 5 posts long.
More to read next week.


Leave a comment