How we used the improvement kata to gain 25% of productivity - Part 3
This is the third post on a series of 5 about the improvement kata. If you haven’t read the beginning of the story, I recommend you start from part 1.
In the previous post, I explained how we started to understand what was going on. We were now questioning our way of handling bugs.
Are we spending too much time on bugs ?
More understanding
Types of tasks
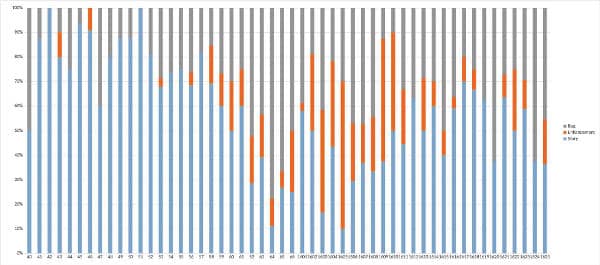
To answer this question, we decided to plot the different types of tasks we had completed per sprint.
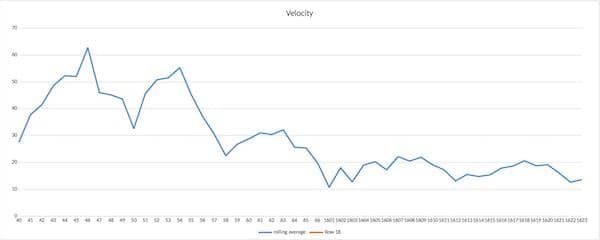
Think again of the velocity curve we started with. We see an almost exact correlation between story count (green bars above) and story points (blue curve below).
💡#NoEstimates works
We can also see that after sprint 56, we were spending more time on bugs and improvements. Improvements are supposed to improve productivity, so we decided to focus on bugs first. Here is what we get if we compute the average number of bugs per sprint :
| Periods | Sprints | Bugs | Average bugs fixed per sprint |
|---|---|---|---|
| 2015, Before sprint 56 | 15 | 21 | 1.4 |
| After sprint 56 | 34 | 210 | 6.1 |
Starting sprint 56, we were fixing 4 times as many bugs as we used to do before !
What is going on with bugs ?
At this point, we felt we’d made a great step forward in our understanding. We almost thought we were done with it …
After a bit of thinking though, it was clear that we were not ! We still needed to understand why we were in this situation.
We started by listing more questions :
- Could it be that we just got a lot better at testing ? Since sprint 56, we had been doing regular exploratory testing. Exploratory testing sessions were very effective at finding bugs.
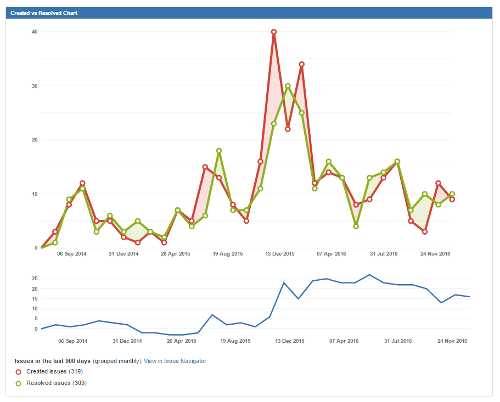
- Were we paying back a bug debt ? The created versus resolved trend seemed to show so. But it could also be that we weren’t testing as well as we used to !
- If we were paying back a bug debt, how close were we to the end of the payback ?
- Were we creating too many flaws in the software ?
- Are we fixing too many bugs ? If so, what should we do to fix less ?
- Are the bugs coming from other teams using our component or from our own testing ?
- Are bugs on new or old code ?
A lot of questions, all difficult to answer. We decided to first see if we were paying back a bug debt. If this was the case, most other questions would become more or less irrelevant. With a bit of thinking, we came up with a measure to get the answer.
Are we paying back a bug debt ?
We first started to do exploratory testing at sprint 56. To do this, we would run a 1 hour session, where the pair finding the more bugs would win fruits. (Later on, we streamlined exploratory testing as part of the workflow for every story) At that time, we used to find more than 10 bugs in 1 hour.
💡Gamification transforms nice developers into berserk testers !
| Explo Test Sesssion | 61 | 62 | 63 | 64 | 66 | 16.01 |
|---|---|---|---|---|---|---|
| Bugs found | 16 | 6 | 16 | 10 | 11 | 11 |
We would do another such a session. If we found significantly less than 10 bugs, let’s say less than 6, it would mean that :
- we improved the quality of our software
- our streamlining of exploratory testing works
- if we continue to search and fix bugs as we do currently, we’ll reach a point where we won’t find any more bugs
Otherwise, none of these stand, and we’ll have to continue our investigations.
So we did a 1 hour, fruit-powered, exploratory testing session. And we found only 3 bugs ! Indeed, we were paying back a bug debt. The question became
When should payback be over ?
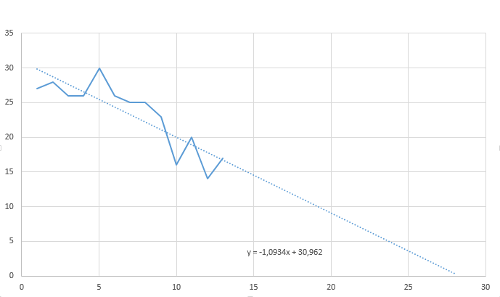
A linear regression on the created vs resolved bug trend showed that we still had 15 more months to go !
Target condition
At that point, the target condition became obvious :
We’d like to be done with bugs within 3 months.
Currently, around 1 pair (25% of the team) was busy fixing bugs. If we’d manage to bring this down, we’d have a 25% productivity boost.
This was post 3 in a series of 5 about the improvement kata. Next post will be about PDCA.


Leave a comment